
How to Calculate Potential Revenue Uplift from Personalization: a Unit-Economics Model
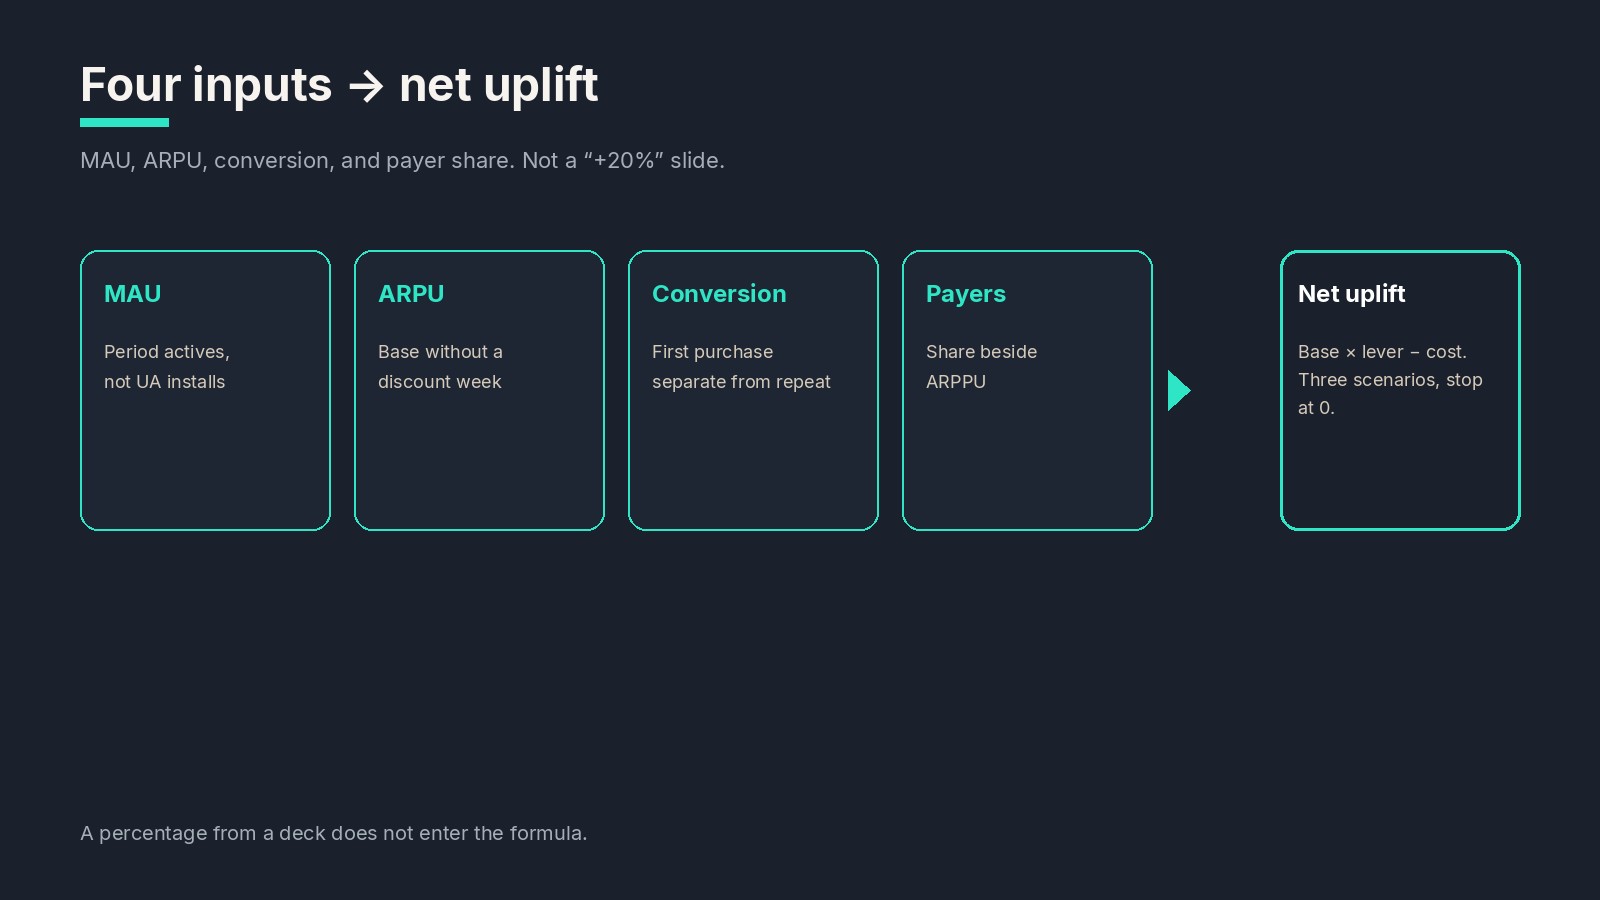
Finance sees a slide that says “personalization will add +20% ARPU” and puts it in the budget. The analyst sees that first-purchase conversion has not moved in three quarters. The producer sees that a post-defeat discount lifted the check and dropped D7. Personalization is not what broke. The arithmetic broke: growth is treated as a percentage from a deck, not as MAU × ARPU × conversion × payer share minus implementation cost and the risk of zero uplift.
Get sandboxThis is a MOFU/BOFU calculator for UA Lead, CMO, Analyst, and studio leads. You leave with a model: three scenarios, an explicit cost, and a stop if uplift is zero. Timelines, the 5,000 unique players per month floor, and “analytics at $0” below are site claims from mone.tools, not a promise for your title. Do not treat unnamed genre cards as proven results.
What the model actually counts, not a “+20%” slide
Unit economics of personalization is not “the model is smart, so revenue will grow.” It is a formula in which every input can be named, measured, and signed. Period revenue = actives × ARPU. ARPU = payer share × ARPPU. First-purchase conversion moves payer share. Personalization belongs in a budget only if you can say which lever it touches and by how much — inside a corridor, not as a single number.
MONE describes a closed loop: collect data → read behavior on Player Journey Maps (PJM) → issue an offer inside Hard Limits → calibrate in an A/B test. The calculator answers a different question: is this cycle worth the studio’s money if uplift does not arrive. A “+20%” slide answers that question with silence.
If the only input is a desired percentage, you train the budget to wait for a miracle. Historical SandBox exists for this: six months of events can show where conversion already exists, where ARPU is held up by a discount, where payer share does not grow, while the analytics layer on the site is $0 (site claim). Connecting personalization makes sense when the analyst can name the four inputs and the producer can say what implementation cost is still acceptable at a zero A/B.
The site’s public pipeline (site claim): SandBox in 1–2 hours at the audit step, telemetry in 1–2 days, personalization launch in 2–3 days once Hard Limits and cohorts exist. Full personalization connection is less than a week (site claim). Those hours do not replace a table in which the conservative scenario still pays for the pilot.
Minimum for an ML personalization pilot on the site: 5,000 unique players per month. Below that floor the cycle is still useful — as an audit of the unit-economics model, not as a promise that the model will “pour +20% into P&L.”
Four inputs without which a percentage is decoration
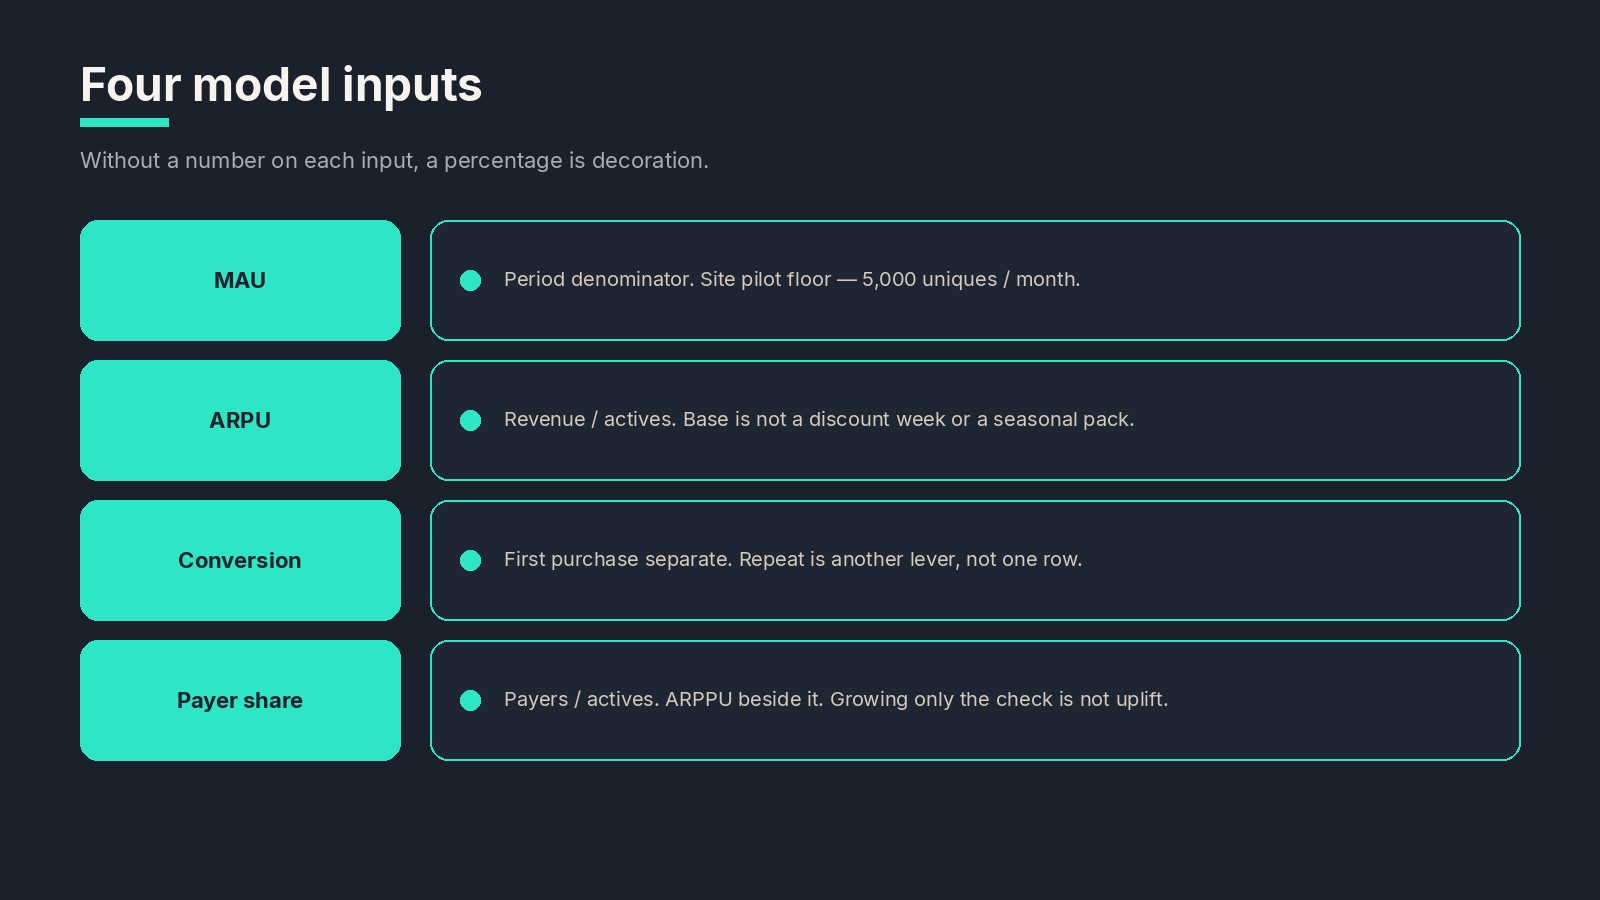
An input is not “one more dashboard metric.” It is a place where you put a number into the formula. If you only see ARPU, you cannot tell a larger check from more payers from more actives.
| Input | What it is | Mistake if |
|---|---|---|
| MAU / uniques | The period denominator, not UA installs | Mix installs with actives and stretch the base |
| ARPU | Revenue / actives for the same period | Take the best discount week as the base |
| Purchase conversion | First and repeat on separate rows | Fold them into one “conversion” for the slide |
| Payer share | Payers / actives; ARPPU beside it, not instead | Grow ARPPU with a discount and call it personalization |
MAU is a floor, not a dream multiplier
Five thousand uniques per month on the site is the pilot floor, not “the more MAU, the more you may promise.” If you plug in an annual peak or a UA forecast, the formula lies in the same direction as the slide. Lock the period: the same weeks you will read the A/B on. Below the floor — explicitly “model audit only,” not a budget line.
ARPU is a base you do not take from a sale
ARPU after an aggressive discount is not a base. It is already an intervention. The base is counted on a window without a new offer and without a seasonal pack you will not repeat in the pilot. Otherwise uplift = “we compared a promo to a promo.”
Conversion: first purchase separate from repeat
First-purchase personalization and whale personalization are different levers. Folding them into one percentage is convenient for a slide and harmful for the model: you will not know whom you “grew” and whom you merely caught earlier. First purchase moves payer share. Repeat moves ARPPU. Write two rows.
Payer share is not a synonym for ARPPU
Payer share can sit still while ARPPU grows because you discounted people who would have paid anyway. That is not personalization uplift. That is revenue pulled forward. The calculator must show both numbers side by side. If only ARPPU moves while payer share is flat — that is the conservative scenario, not the base.
How to assemble uplift: base × lever − cost
Uplift is not “ARPU × 1.2.” It is the period revenue difference between control and variant, rewritten on your inputs, minus implementation and operating cost. Until cost is in the formula, every plus looks free.
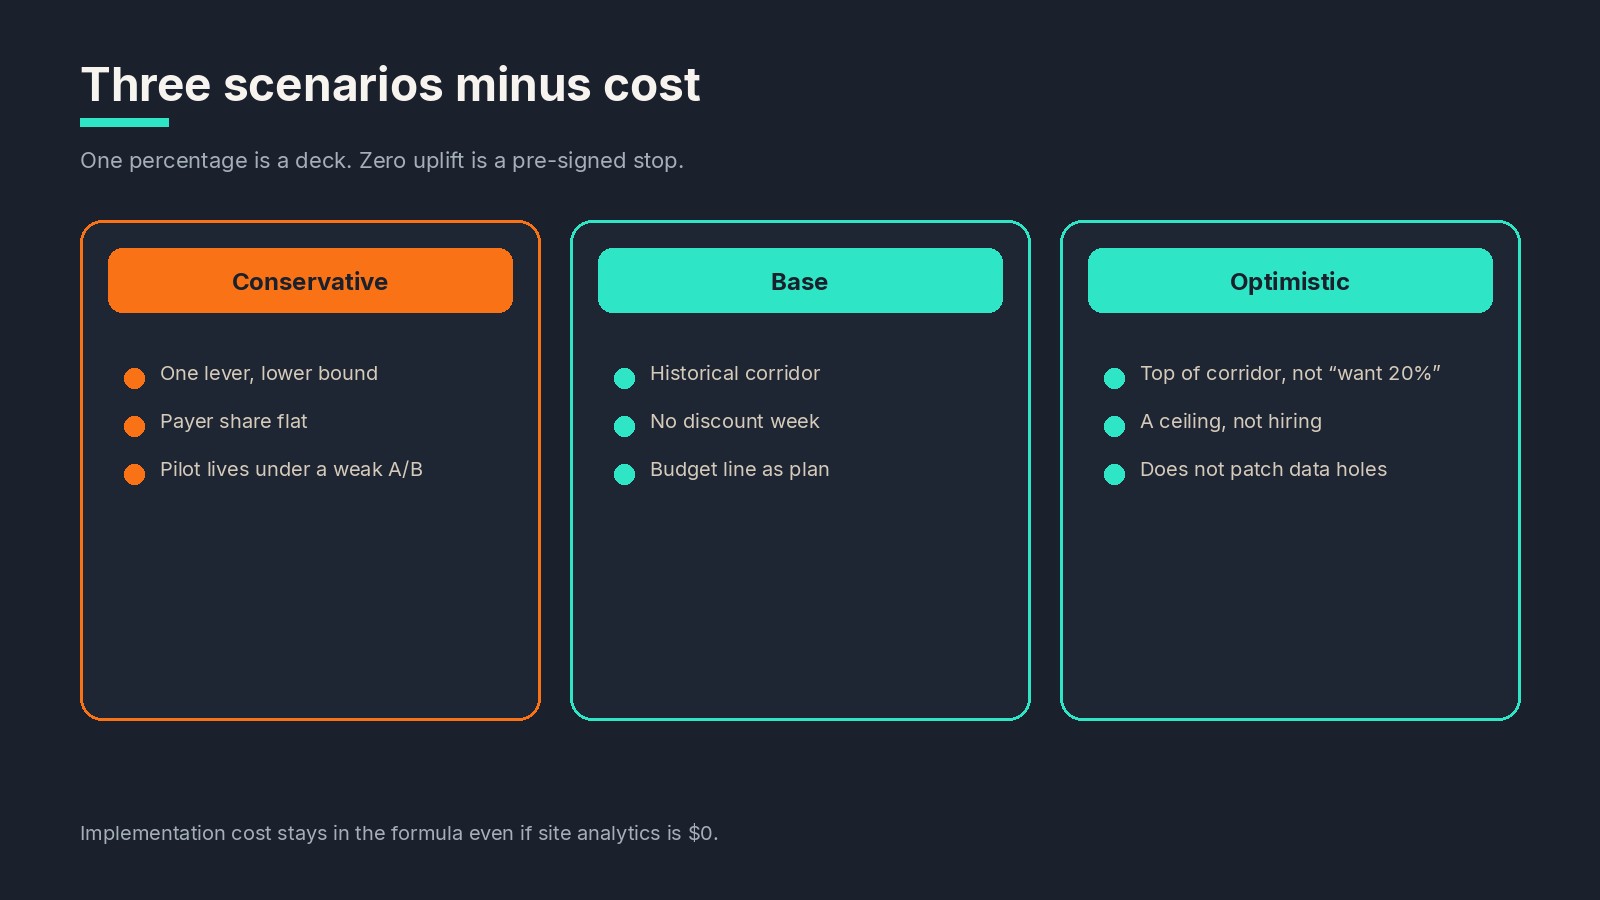
Three scenarios are mandatory. One percentage is a deck.
| Scenario | Assumption | What it is for |
|---|---|---|
| Conservative | Move one lever at the lower bound; payer share flat | Tests whether the pilot lives under a weak A/B |
| Base | Historical conversion and ARPU corridor, no promo | What you may carry into the budget as plan |
| Optimistic | Top of the corridor, not “we want 20%” | A ceiling; not the line you hire against |
Implementation cost on the site is not sold as “a license up front”: analytics is a free layer, and payment for personalization starts after confirmed ARPU uplift (site claim). Your table still needs a row: studio hours, SDK, offer design, LiveOps capacity. Otherwise “free for the vendor” is read as “free for P&L.”
The site’s public window (site claim): 4 weeks of training and measurement, then 3–5 days of evaluation. Do not mix that with “Sandbox in 48 hours” on the first screen — that is a different stage. On SandBox history you can see which levers actually reach money before you turn personalization on.
Uncertainty is its own row, not a footnote. Name what you do not know: Privacy strips the identifier, traffic is below the floor, the only spot is “after a defeat.” The longer the list, the closer you stay to the conservative scenario. Optimistic does not patch holes.
When “growth” is not yet a decision to scale
Name the red cell out loud before the quarterly budget names it after you “locked in +20%.”
- The formula is one percentage; there are no three scenarios.
- The ARPU base is taken from a discount week.
- Implementation cost = 0 because “analytics is free.”
- There is no “uplift = 0” row: what you do with the pilot and the budget.
- Traffic is below the site floor, but the slide already shows annual P&L.
- Success is only spot ARPU, without a D7 cohort and without payer share.
- Privacy: the identifier is gone, and “personal uplift” is still user-level, not aggregate.
If any item is you, you are on a model audit, not on scale. SandBox exists for this: see which inputs even reach a decision, do not buy a license early. The site’s commercial frame does not cancel the table: a zero A/B must be a pre-signed stop, not a surprise on week 5.
Who owns the calculator, not “the model will pour it in”
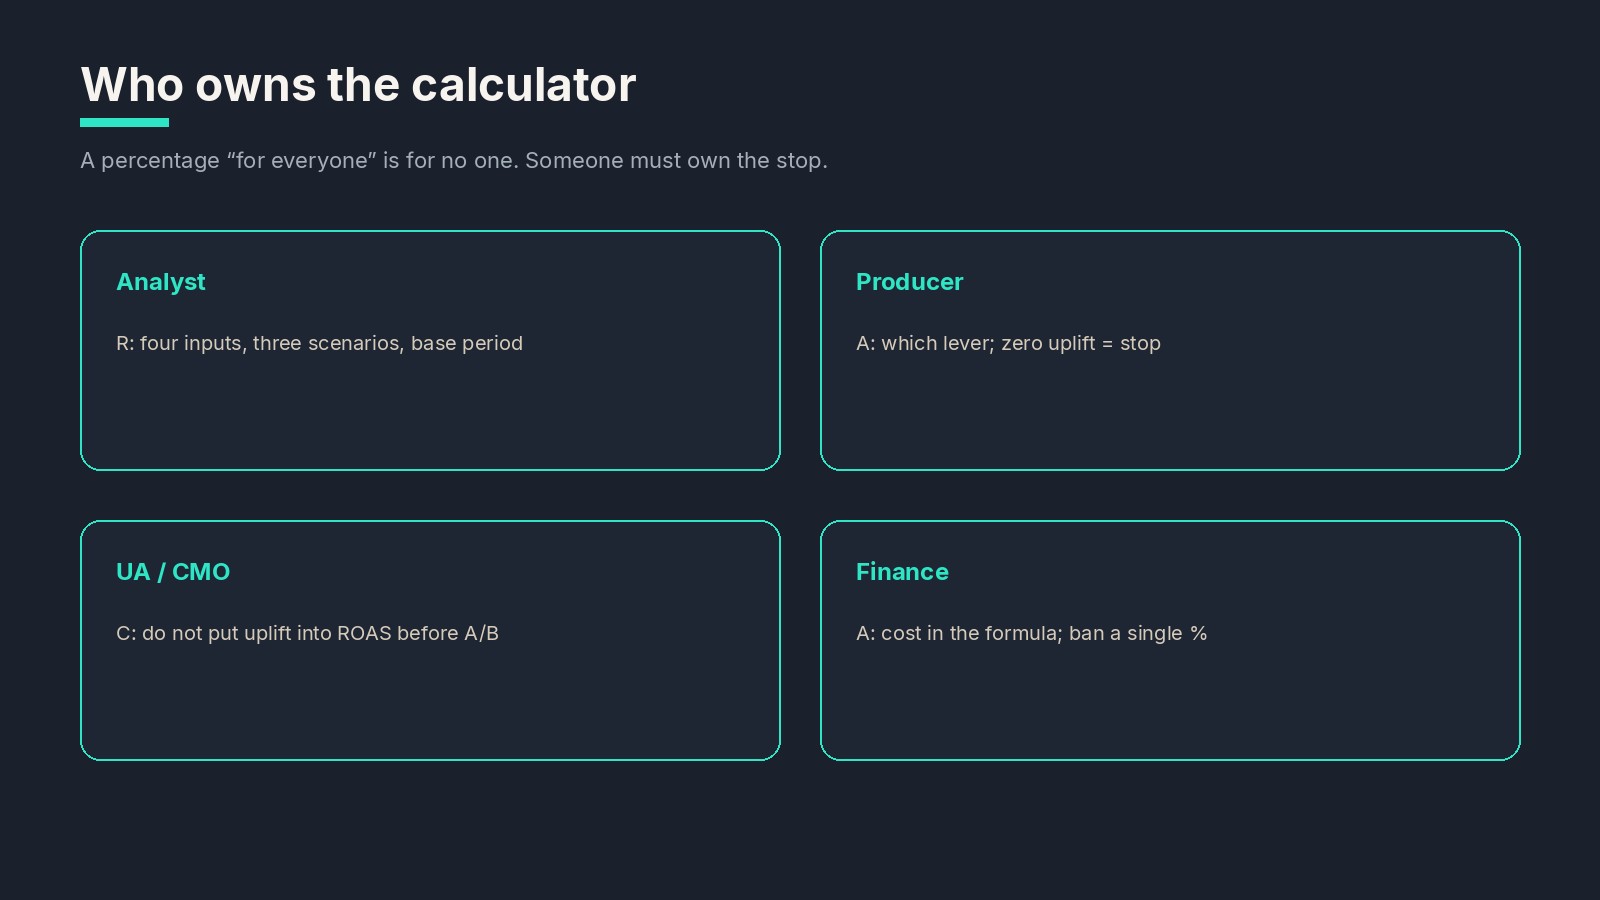
The cycle dies when the percentage is “for everyone” and for no one. Use a RACI-style split. R = does the work, A = decides, C = consulted, I = informed.
| Role | Calculator | Stop |
|---|---|---|
| Analyst | R: four inputs, three scenarios, base period | R: do not plug a promo in as the base |
| Producer | A: which lever we touch (first purchase / ARPPU / spot) | A: zero uplift = stop scale |
| UA / CMO | C: do not put uplift into ROAS before A/B | C: do not kill a campaign on a D1 check |
| Finance / Founder | A: studio cost in the formula; “uplift = 0” row | A: ban a budget with one percentage |
| Vendor | C: comparable PJM slices | I until the studio widens the scope |
Checklist (print it)
- Four inputs named: MAU, ARPU, conversion (first separate), payer share / ARPPU.
- Three scenarios: conservative, base, optimistic. There is no single percentage.
- The base is not a discount week. The period matches the A/B window.
- Implementation cost is in the formula, even if analytics on the site is $0.
- There is a signed stop at uplift = 0. Silence = scale “because we already started.”
- Unique / month floor named; below it — explicitly “model audit only.”
- UA does not put uplift into ROAS before the A/B decision.
- The calculator has an A. “The model will add +20%” is a red cell.
Takeaways
- A percentage from a slide is not unit economics. You count MAU, ARPU, conversion, and payer share for one period.
- Uplift = difference versus base minus cost. Without cost, every plus looks free.
- Three scenarios are mandatory. Optimistic does not patch holes in the data.
- Zero uplift is a pre-signed stop, not “one more model sprint.”
- SandBox can show which levers are even alive in history while analytics on the site is $0. Scale still needs a corridor, A/B, and D7.
Request SandBox, not a license
If you have roughly six months of events and an analyst who can name the four inputs, the next step is a historical audit: where conversion already exists, where ARPU is held up by a discount, which conservative scenario still pays for the pilot. Start with the MONE audit / SandBox path or the pipeline. Studio console: dash.mone.tools. Analytics is a free layer; payment for personalization, per the site, starts only after an A/B test confirms ARPU uplift.
Read next
- ARPU, ARPPU, LTV, and purchase conversion: which metrics actually define the game economy
- How to connect in-game monetization with User Acquisition and ROAS
- How to run a monetization A/B test and prove real revenue lift
- Is your mobile game ready for ML personalization: a team checklist
- From Audit to Scale: monetization personalization in one cycle