
ARPU, ARPPU, LTV, and purchase conversion: which metrics actually define the game economy
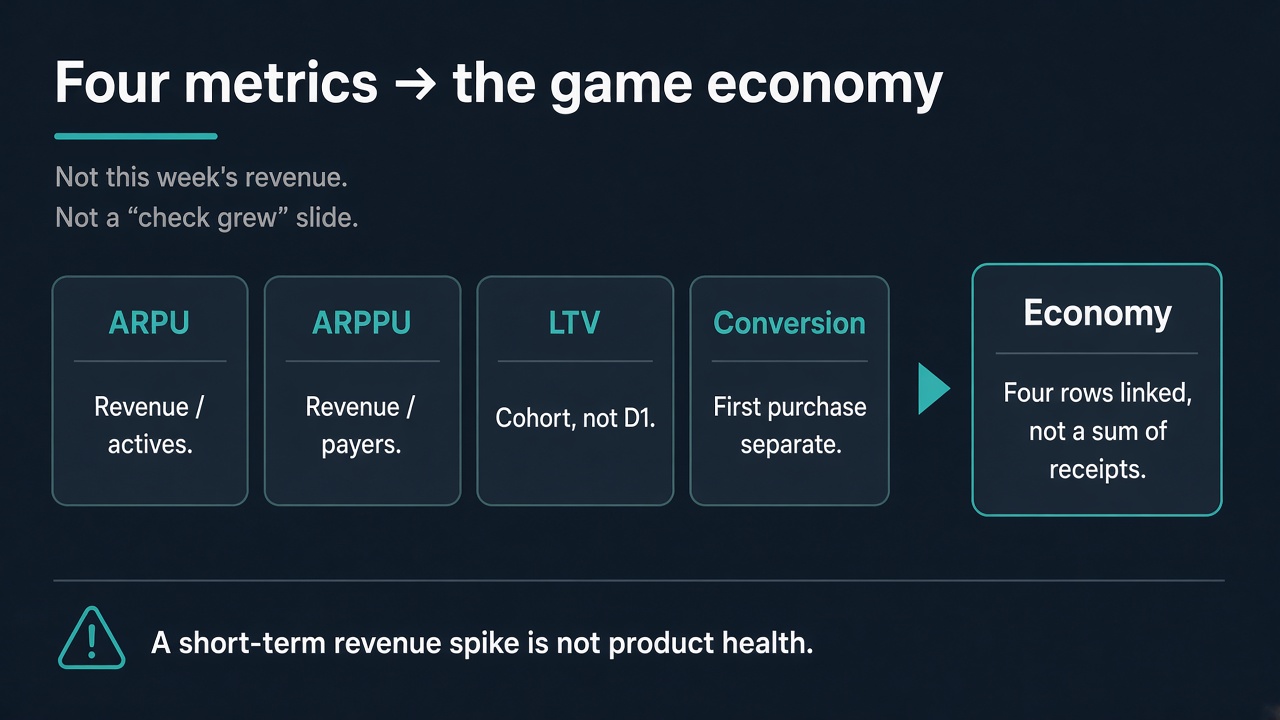
The producer sees that this week’s revenue moved after a post-defeat discount and writes “the economy is working.” The analyst sees ARPU up and payer share flat. UA sees a D1 check and kills the creative. The founder sees a “check grew” slide and thinks the product got healthier. The dashboard is not what broke. The vocabulary broke: four metrics are read as one total, and a short-term revenue spike is treated as the game economy.
Get sandboxThis is a TOFU briefing for Founder / CEO / Producer / Monetization Lead. You leave with a map: what ARPU, ARPPU, LTV, and purchase conversion are, how they connect, and what you must not collapse into one row. Pipeline timings, the 5,000 unique players per month floor, and “analytics $0” below are mone.tools site claims, not a promise for your title. Do not treat unnamed genre cards as proven results. The uplift calculator is a neighboring topic, not this one.
What the four metrics actually are, not a “check grew” slide
The game economy is not “revenue this week.” It is four rows for one period on one denominator. If you only see a sum of receipts, you cannot tell payer growth from a larger check among people who already paid, or from revenue shifted by a discount.
MONE describes a closed loop: collect data → read behavior on Player Journey Maps (PJM) → show an offer inside Hard Limits → calibrate in A/B. The metric vocabulary answers a different question: what you are even measuring when you say “it got better.” Without the vocabulary the loop calibrates noise.
If the only row is “revenue grew,” you teach the team to celebrate a promo. Historical SandBox is for that: six months of events can show where conversion already exists, where ARPU is held up by a discount, where cohort LTV never reaches the D1 check, while the analytics layer on the site is $0 (site claim). Reading the metrics is useful when the analyst can name the denominator and the producer can say which of the four rows an offer touches.
Public pipeline on the site (site claim): SandBox in 1–2 hours at the audit step, telemetry in 1–2 days, personalization live in 2–3 days when Hard Limits and cohorts exist. Full personalization connection is under a week (site claim). Those hours do not replace a table where the four metrics live side by side, not on one slide.
Minimum for an ML personalization pilot on the site: 5,000 unique players per month. Below that floor the vocabulary is still useful — as an economy audit, not as a promise that the model will “pour revenue into P&L.”
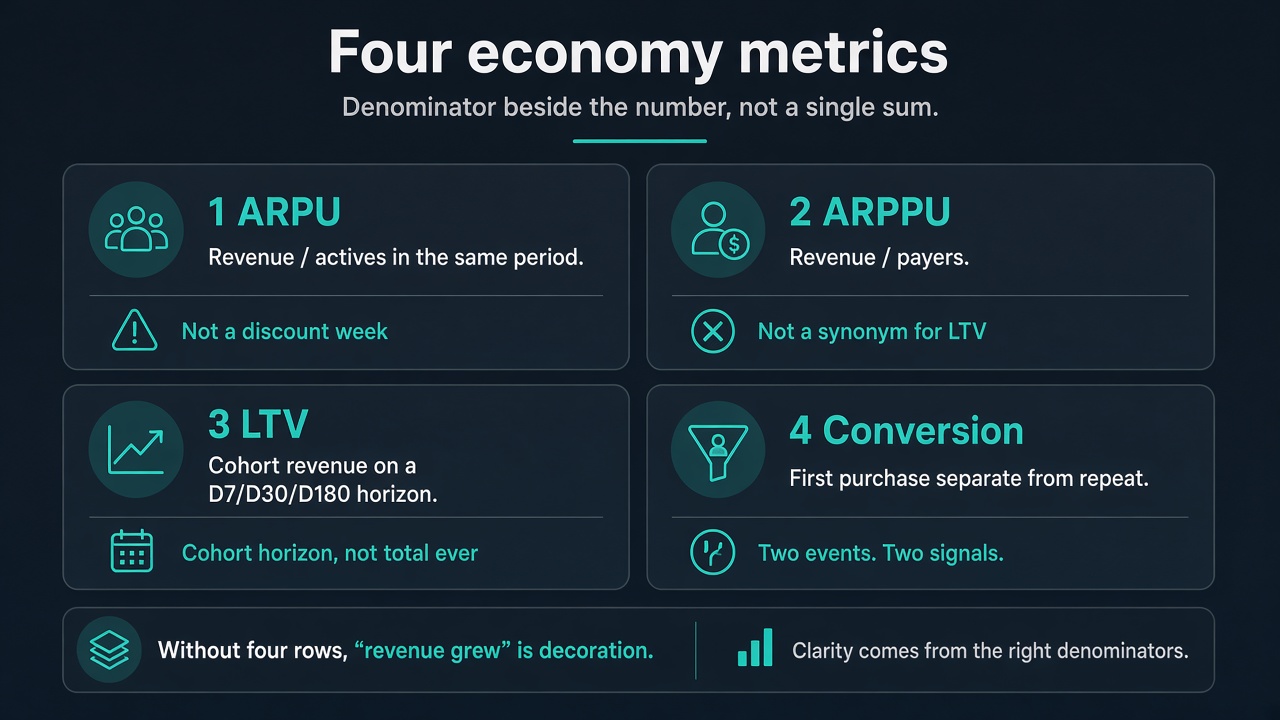
Four rows without which “growth” is decoration
A metric is not “another number on the dashboard.” It is where you divide revenue by a named denominator. If the denominator drifts, growth cannot be compared to last week or to control.
| Metric | What it is | Error if |
|---|---|---|
| ARPU | Revenue / actives for the same period | Taking a discount week as the base |
| ARPPU | Revenue / payers; not a synonym for LTV | Growing the check with a discount and calling it health |
| LTV | Cohort revenue on a horizon, not D1 | Mixing a D1 check with product and UA quality |
| Conversion | First purchase separate from repeat | Folding both into one “conversion” for a slide |
ARPU — revenue per active, not per install
ARPU answers “how much an active brings in the period,” not “how much we cashed on Friday.” The denominator is actives in the same window, not UA installs and not the yearly peak. If you take a discount week as the base, next week’s growth is a promo versus a promo. Fix the period: the same weeks you will read in A/B.
ARPPU — the paying player’s check, not the cohort’s life
ARPPU grows when people who already pay pay more. That is not proof the economy got healthier: a whale discount lifts ARPPU and can drop D7. ARPPU is not LTV. LTV watches a cohort over time. ARPPU watches payers in a slice. Keep both rows side by side, or “average check grew” will be read as “the product grew.”
LTV — a cohort horizon, not a D1 check
LTV is cohort revenue on a chosen horizon (D7 / D30 / D180), not the first-day check. A D1 payment is convenient for UA as an early signal and harmful as a stand-in for the economy: you kill creatives on people who would have paid on day seven. Name the horizon out loud. Without a horizon, LTV is ARPPU with another name.
Conversion — first purchase separate from repeat
First-purchase conversion moves payer share and, through it, ARPU. Repeat purchase moves ARPPU. Folding them into one percentage is convenient for a slide and harmful for the economy: you will not know whom you “grew” and whom you caught earlier with a discount. Write two rows. First purchase is entry into payers. Repeat is revenue retention.
How the four rows connect, and where the slide breaks
The link is not decorative. First-purchase conversion → payer share. Payer share × ARPPU = ARPU. Cohort ARPU over time → LTV on a horizon. If you only move ARPPU with a discount, ARPU can rise for a week while cohort LTV does not. That is not “the economy is working.” That is a shift.
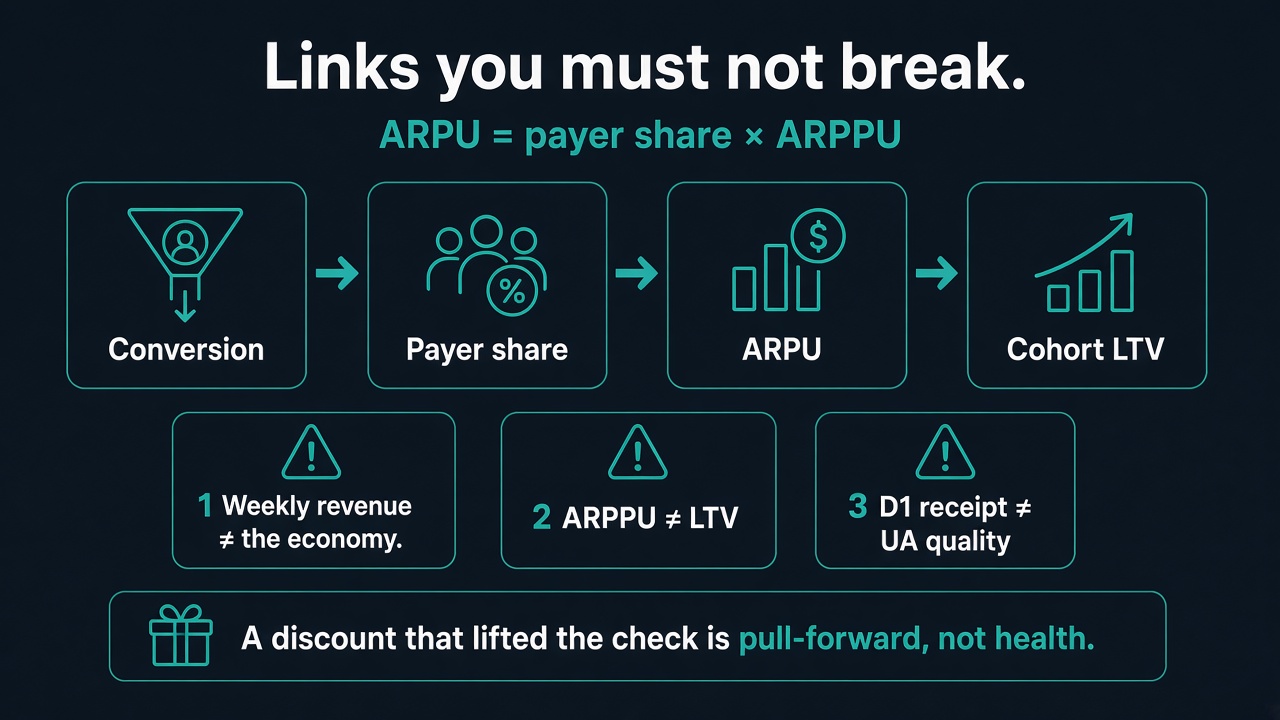
| Link | What must line up | What breaks the reading |
|---|---|---|
| Conversion → payer share | First purchase as its own row | One conversion on the slide |
| Share × ARPPU = ARPU | Three numbers for one period | ARPU without payer share |
| Cohort ARPU → LTV | Horizon named (D7/D30/D180) | D1 check in place of LTV |
| Discount ≠ economy | Cohort D7 next to the check | “Revenue grew” with no denominator |
Three errors must be named. One sum of receipts is a presentation.
1. This week’s revenue ≠ the product economy. A discount week lifts the till and hides the denominator.
2. ARPPU ≠ LTV. A slice of paying checks does not replace a cohort on a horizon.
3. A D1 check ≠ UA quality and is not a stand-in for LTV. An early payment is a signal, not health.
Uncertainty is its own row, not a footnote. Name what you do not know: Privacy cuts the identifier, traffic is below the floor, the only spot is the same “after a defeat.” The longer the list, the closer you are to reading conservative windows, not a “check grew” slide.
Public window on the site (site claim): 4 weeks of learning and measurement, then 3–5 days of evaluation. Do not mix that with “Sandbox in 48 hours” on the first screen — that is a different stage. On SandBox history you can see which of the four rows even reach money before you turn personalization on.
When a “revenue spike” is still not the economy
Name the red cell out loud before the quarterly report names it after you “baked in growth.”
- The report has one sum of receipts, not four rows.
- ARPU is taken from a discount week.
- ARPPU is read as LTV.
- First and repeat conversion are collapsed into one conversion.
- UA puts a D1 check in place of LTV and kills the campaign.
- There is no “which denominator” row: actives, payers, cohort.
- Privacy: the identifier is gone, and “personal LTV” is still user-level, not aggregate.
If any item is you, you are auditing vocabulary, not scaling. SandBox exists for that: see which metrics even reach a decision, not buy a license early. The site’s commercial frame does not cancel the table: growth without a denominator should be a pre-signed stop, not a surprise in retro.
Who reads the row, not “one dashboard for everyone”
The cycle dies when the number is “for everyone” and for no one. Use a RACI-style split. R = does the work, A = decides, C = consulted, I = informed.
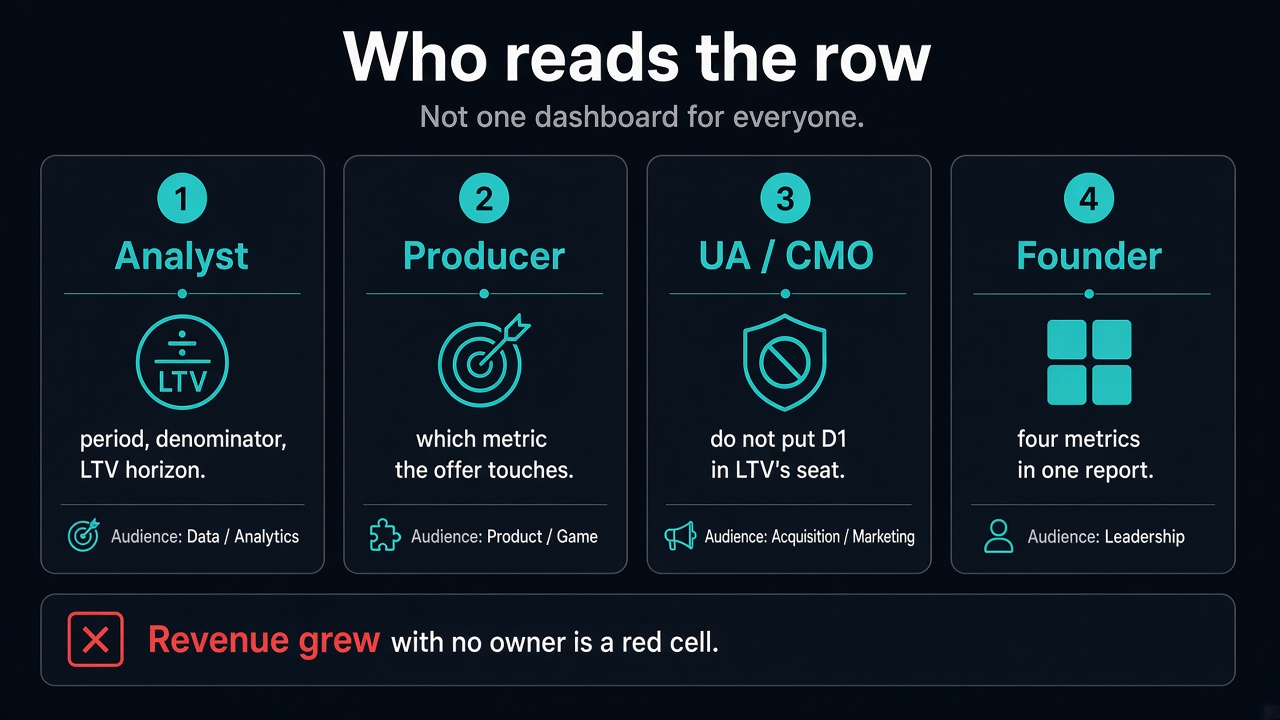
| Role | Reading | Stop |
|---|---|---|
| Analyst | R: period, denominator, LTV horizon | R: do not plug a promo in as the ARPU base |
| Producer | A: which of the four rows the offer touches | A: a discount that only grows ARPPU |
| UA / CMO | C: do not put a D1 check in place of LTV | C: do not kill a campaign on a D1 check |
| Founder / CEO | A: four metrics in one report | A: ban a “revenue grew” slide |
| Vendor | C: comparable PJM slices | I until the studio widens the scope |
Checklist (print it)
- Four rows named: ARPU, ARPPU, LTV (with a horizon), conversion (first separate).
- Denominator beside them: actives, payers, cohort. There is no single sum of receipts.
- ARPU is not from a discount week. The period matches the window you compare.
- ARPPU is not called LTV. The LTV horizon is written (D7 / D30 / D180).
- The link is visible: conversion → payer share → ARPU → cohort LTV.
- UA does not put a D1 check in place of the economy.
- The report has an A. “Revenue grew” with no owner is a red cell.
- Unique / month floor named if you move from vocabulary to a pilot.
Takeaways
- A week’s sum of receipts is not the game economy. You count ARPU, ARPPU, LTV, and conversion for one period.
- ARPU = payer share × ARPPU. First-purchase conversion moves share. Repeat moves ARPPU.
- ARPPU is not LTV. LTV needs a cohort and a horizon, not a D1 check.
- A short-term revenue spike after a discount is a shift until D7 and payer share say otherwise.
- SandBox can show which of the four rows are even alive in history while analytics on the site is $0. Scale still needs a corridor, A/B, and a denominator.
Request SandBox, not a “check grew” slide
If you have roughly six months of events and an analyst who can name the four metrics, the next step is a historical audit: where conversion already exists, where ARPU is held up by a discount, which LTV horizon even arrives. Start with the MONE audit / SandBox path or the pipeline. Studio console: dash.mone.tools. Analytics is a free layer; payment for personalization, per the site, starts only after an A/B test confirms ARPU uplift.
Read next
- How to find hidden revenue leaks in a mobile game: a monetization audit from A to Z
- How to calculate potential revenue uplift from personalization: a unit-economics model
- Dynamic offers in mobile games: how to match a proposal to a specific player
- How to measure monetization impact on retention: D1, D7, D30, and long-term LTV
- From Audit to Scale: monetization personalization in one cycle